GIS capabilities across agencies are highly variable. Many users are still desktop-centric, with interest in continuing to use Esri’s ArcMap or ArcGIS Pro, internally. These platforms, however, require training, background knowledge, and licensing that can be cumbersome and expensive for agencies to maintain.
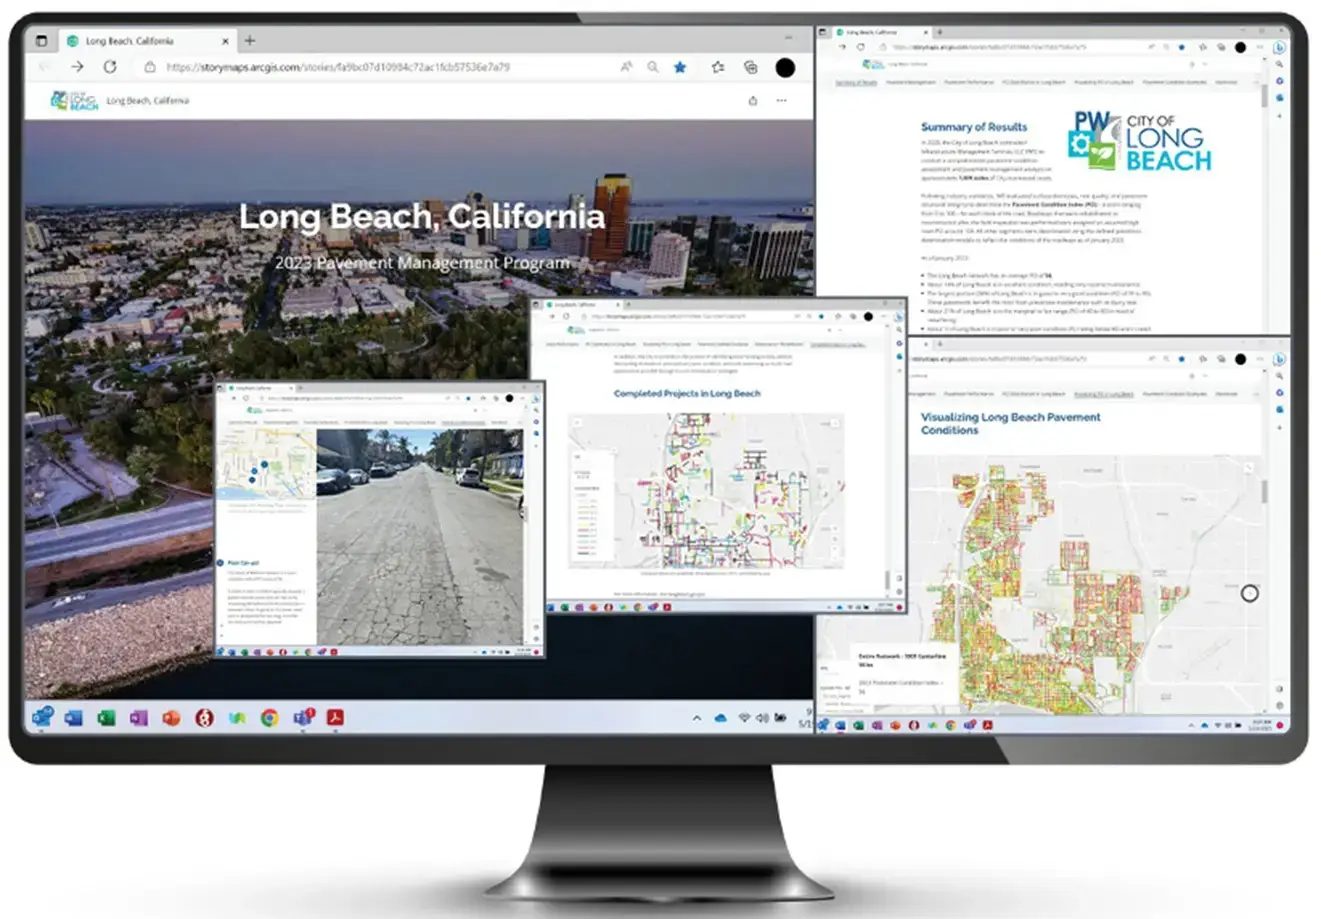
We are continuously improving our ability to push our GIS data to the cloud and make it accessible through ArcGIS Online via Story Maps and Dashboards, and therefore more accessible to not only internal stakeholders at the agency, but to their constituents themselves should clients prefer an Esri-based visualization tool to Inform™. We believe in working closely with our clients to understand their specific needs and can create customized, web-based dashboards that illustrate the data we collect during our surveys in a multitude of ways.
Our team expertly blends creativity with technical expertise to transform intricate technical information into engaging narratives, using visual storytelling techniques to convey insights effectively. Our storyboards illustrate spatial relationships, trends, and patterns, making data more accessible and actionable.
Trust us to craft compelling narratives that inspire innovation, foster collaboration, and drive informed decision-making.