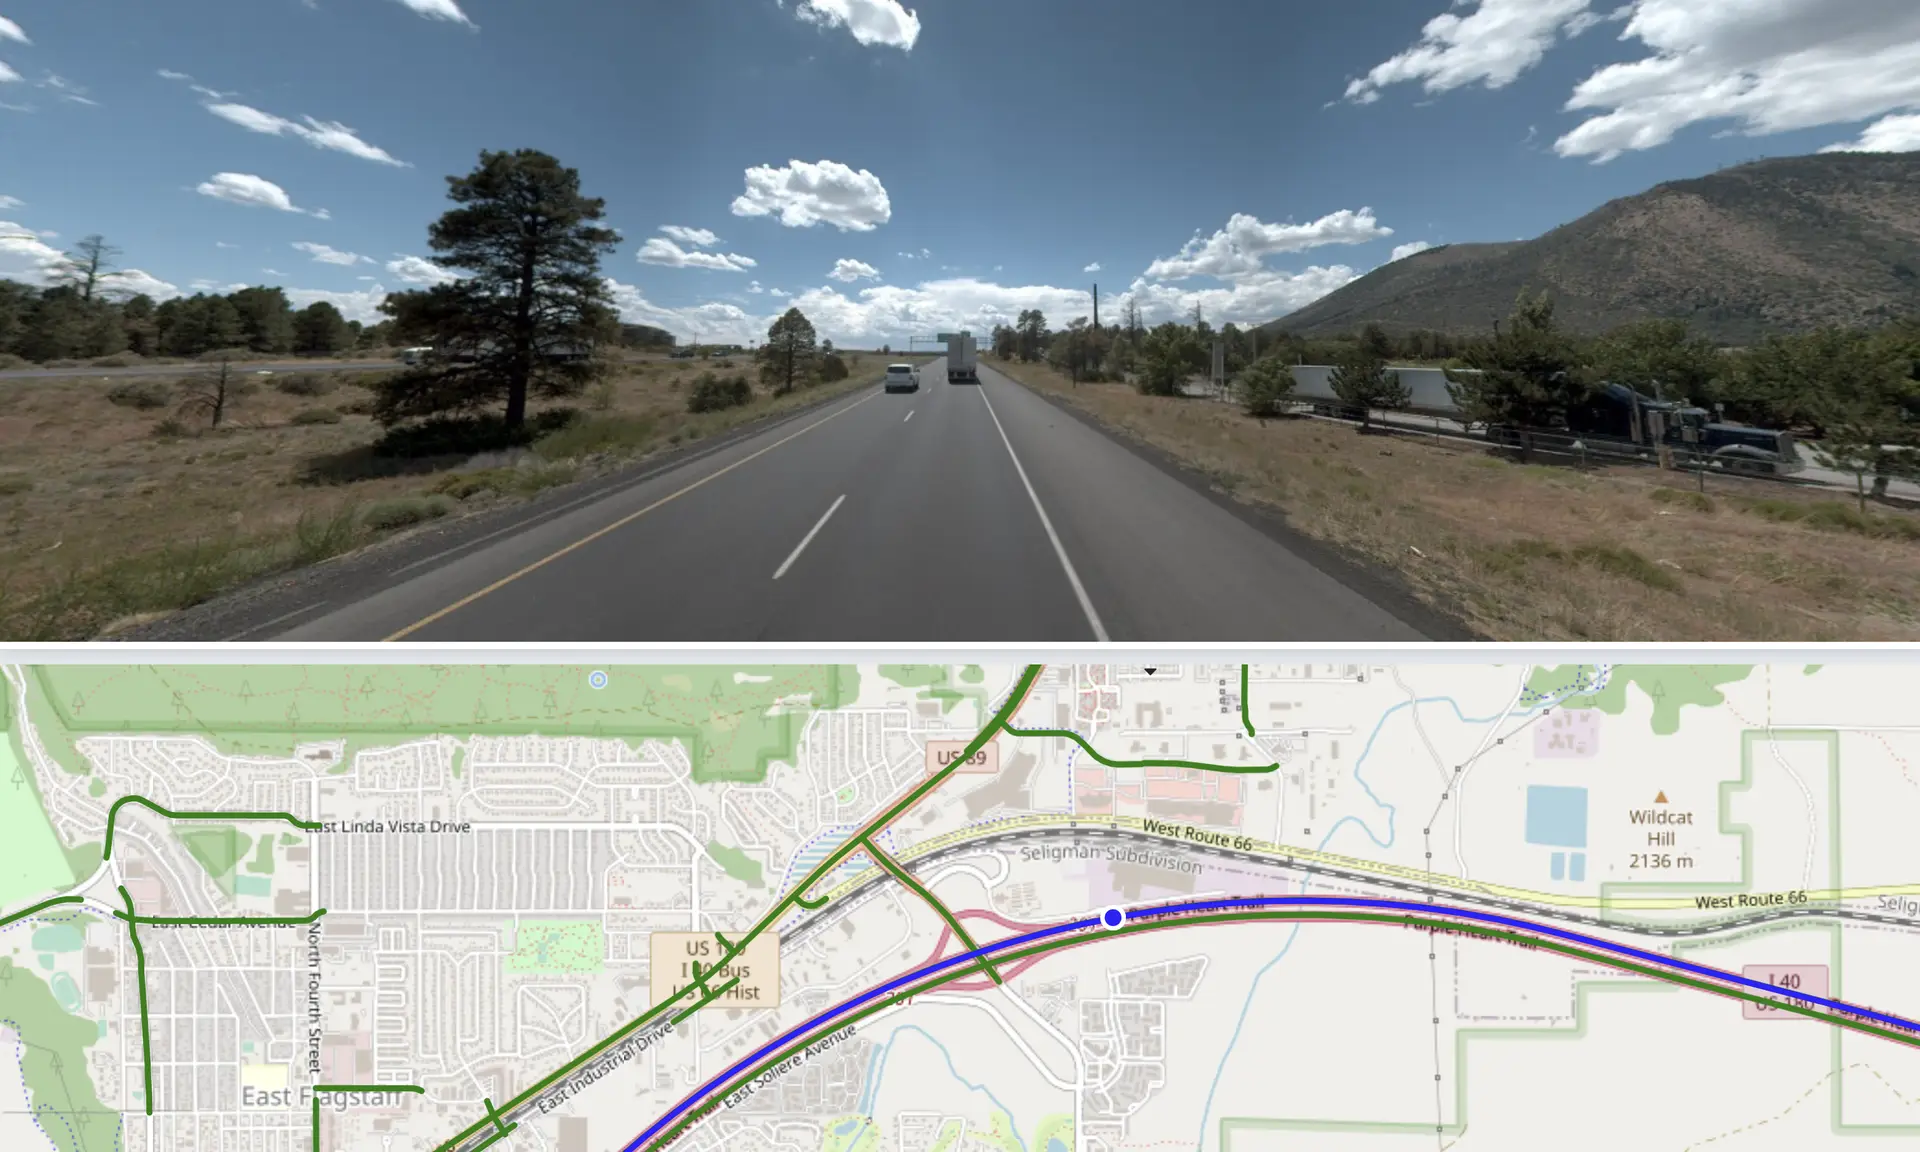
DATA VISUALIZATION AND HOSTING
Road data visualization is a powerful tool for local leaders to understand, communicate, and address transportation challenges in their communities. It supports data-driven decision-making, enhances community engagement, and contributes to more efficient and sustainable development.
Our team utilizes maps, charts, graphs, and visual elements along with Inform™ to help convey complex data about road networks and ROW assets. Our goal is to make data more accessible, understandable, and actionable for a variety of stakeholders, including local leaders, policymakers, and the public. All of these tools assist with:
Decision-Making
Visualizing road data can provide local leaders with a clear and comprehensive understanding of the current state of transportation infrastructure, traffic flow, and potential problem areas. This information is crucial for making informed decisions about infrastructure development, maintenance, and improvements.
Efficient Resource Allocation
By visualizing data on road conditions, traffic congestion, and accident hotspots, local leaders can allocate resources more efficiently. This includes optimizing traffic signal timings, identifying areas that need road repairs, and deploying law enforcement to improve safety.
Community Engagement
Visualizations can be powerful tools for engaging the community. They make it easier for residents to understand the challenges and plans for road development and transportation projects. This transparency fosters trust and allows for public input in decision-making processes.
Emergency Response Planning
In the event of natural disasters, accidents, or other emergencies, road data visualization can be invaluable for planning and executing effective emergency responses. Visualizing evacuation routes, traffic patterns, and potential bottlenecks can save lives and reduce chaos during critical situations.
Traffic Management
Real-time visualization of traffic patterns helps in managing and optimizing traffic flow. Local leaders can use this data to implement dynamic traffic control measures, such as adjusting signal timings or providing real-time traffic information to drivers.
Environmental Impact Assessment
Visualization tools can aid in assessing the environmental impact of road construction projects. This includes analyzing potential disruptions to ecosystems, air quality, and noise levels.
Smart City Initiatives
Many cities are moving towards becoming “smart cities” by integrating technology to enhance efficiency and quality of life. Road data visualization is a key component of smart city initiatives, enabling the integration of technologies like intelligent transportation systems and traffic management solutions.
Our clients


