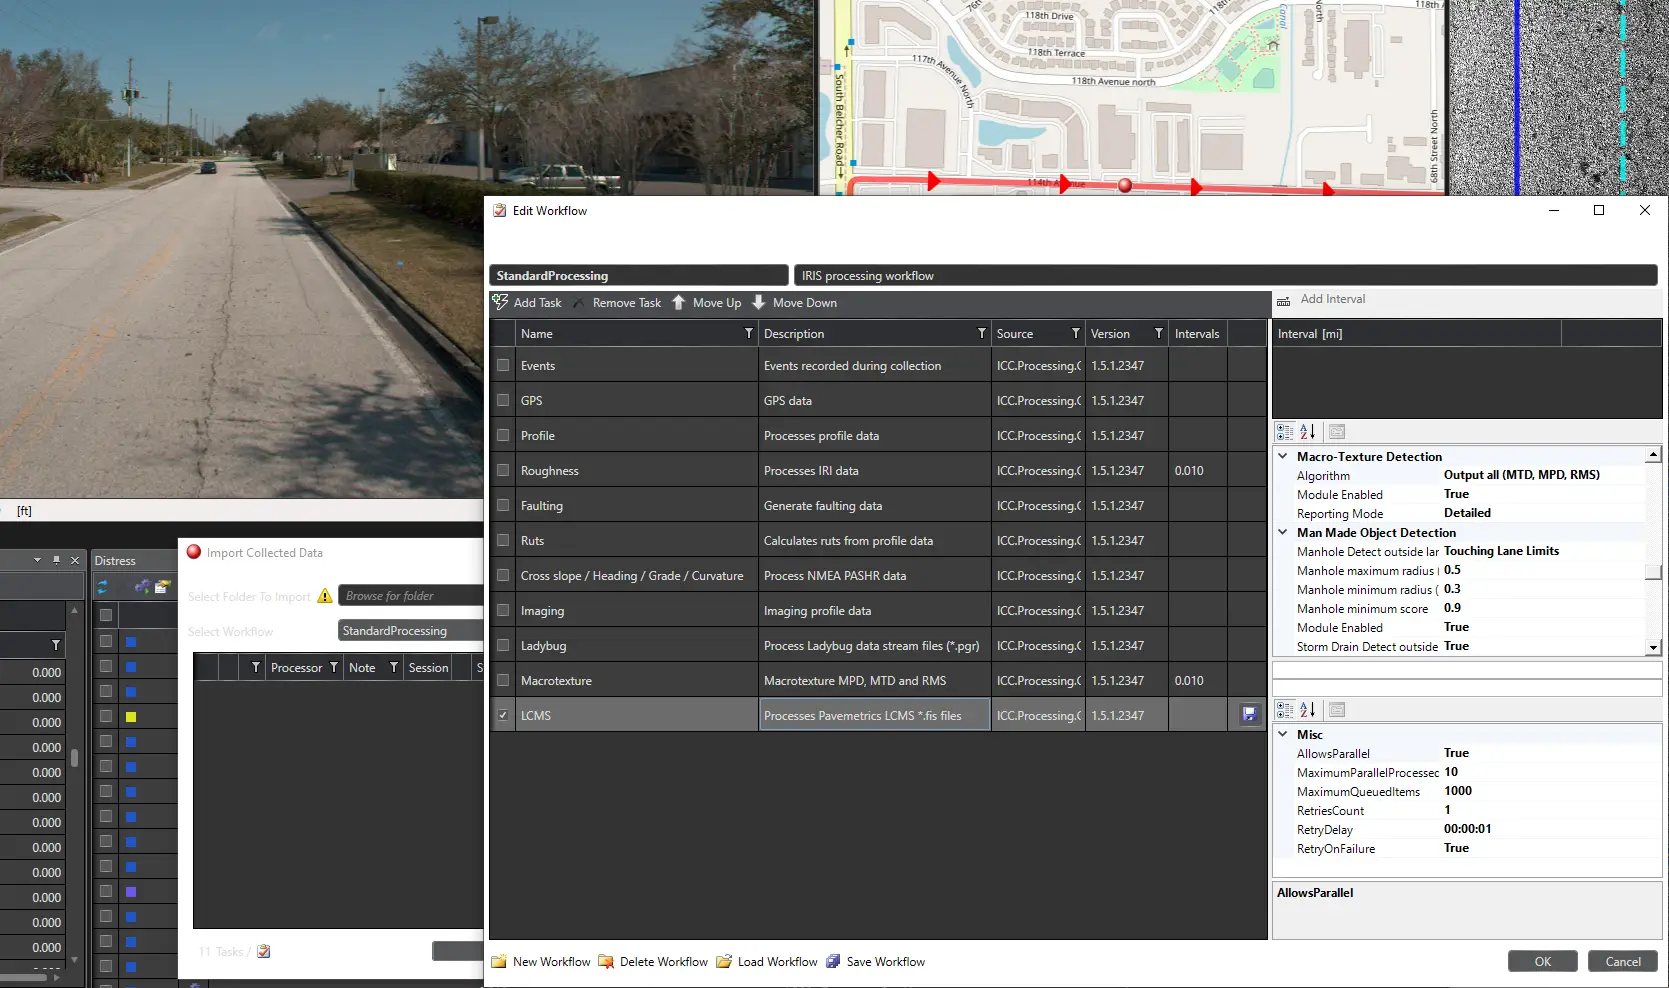
One-step import
The one-step import of all collected data from your Drive-based equipment will get you viewing your data faster. Batch process each data stream with your settings saved for each project.
The Connect™ processing engine uses multi-threading for time consuming steps such as right-of-way image extraction and LCMS processing to yield much faster throughput than is possible using the software provided by the sensor manufacturers. This allows you to maximize workstation and server resources in your processing workflow.
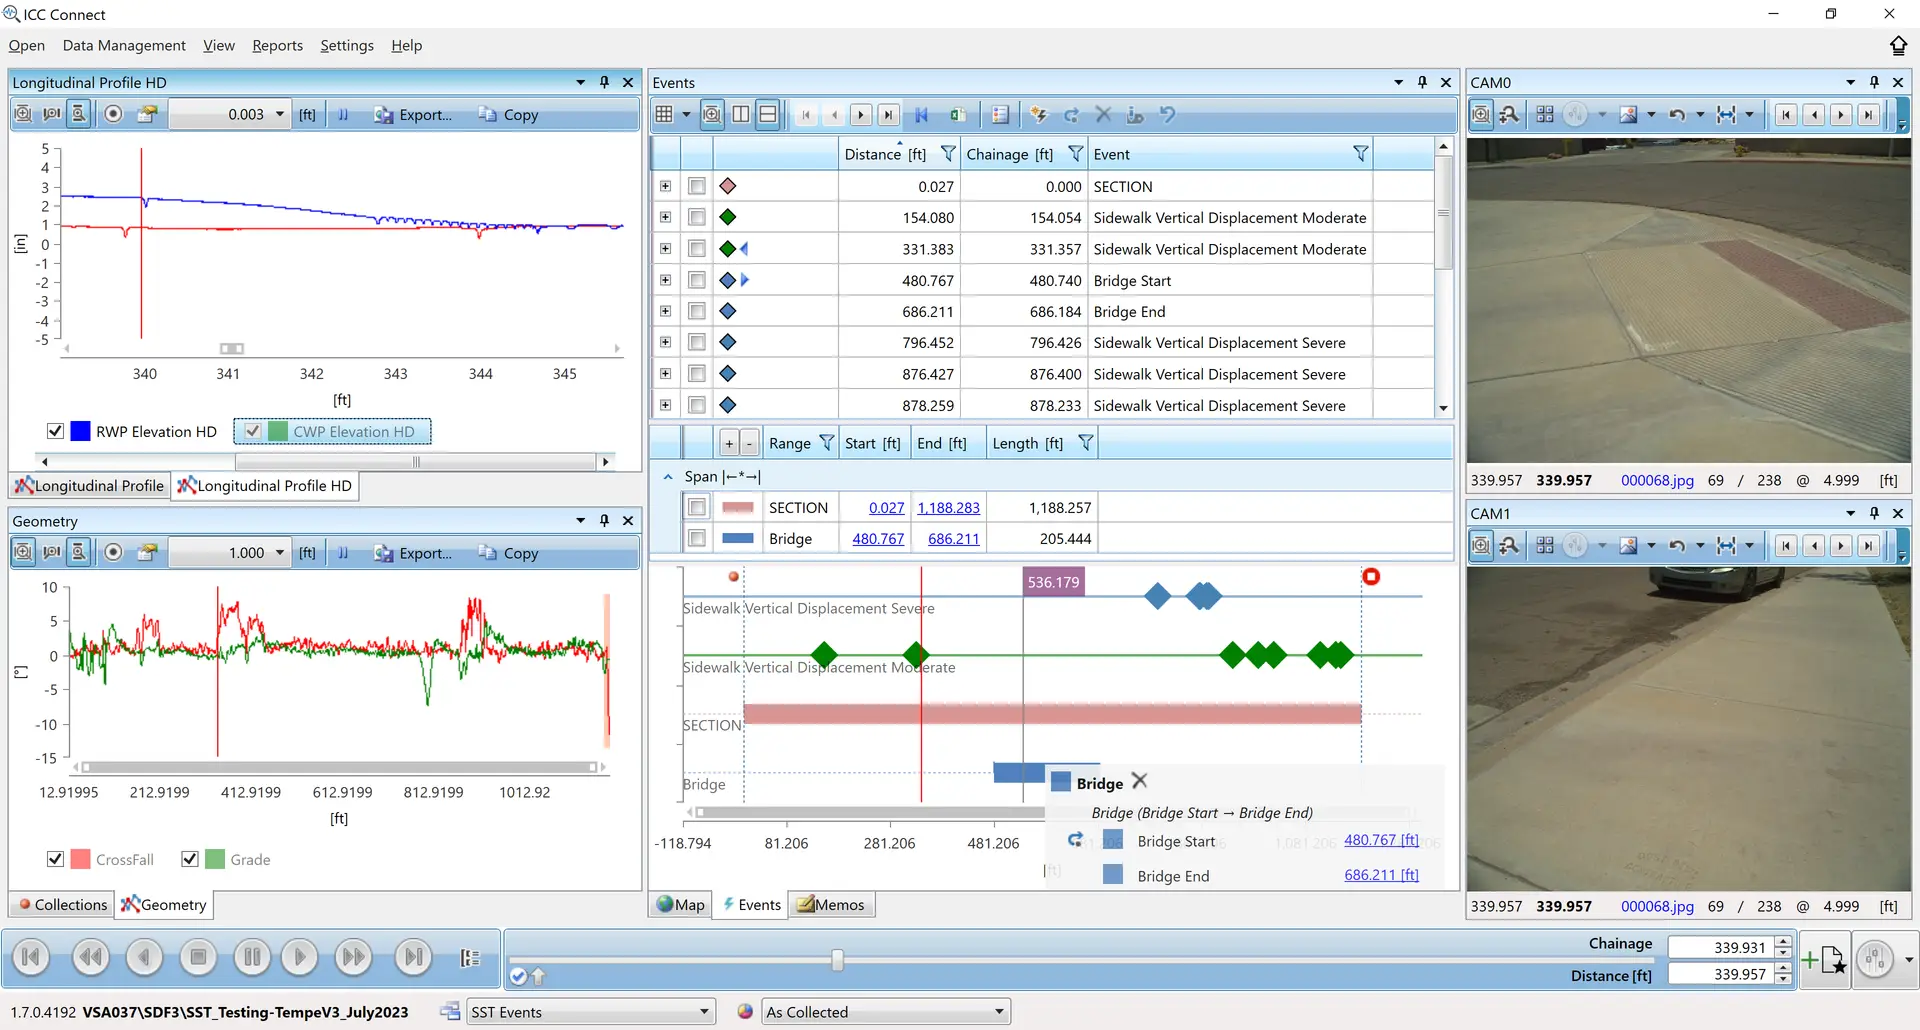
Visual events editing
Field operators do their best to identify important features as they go, but sometimes events need to be updated in the office. With Connect™, event and feature locations can be updated safely, easily, and with greater location accuracy in the office. You can add, move, and delete point and span events such as bridges, railroad crossings, construction zones, lane deviations, etc.
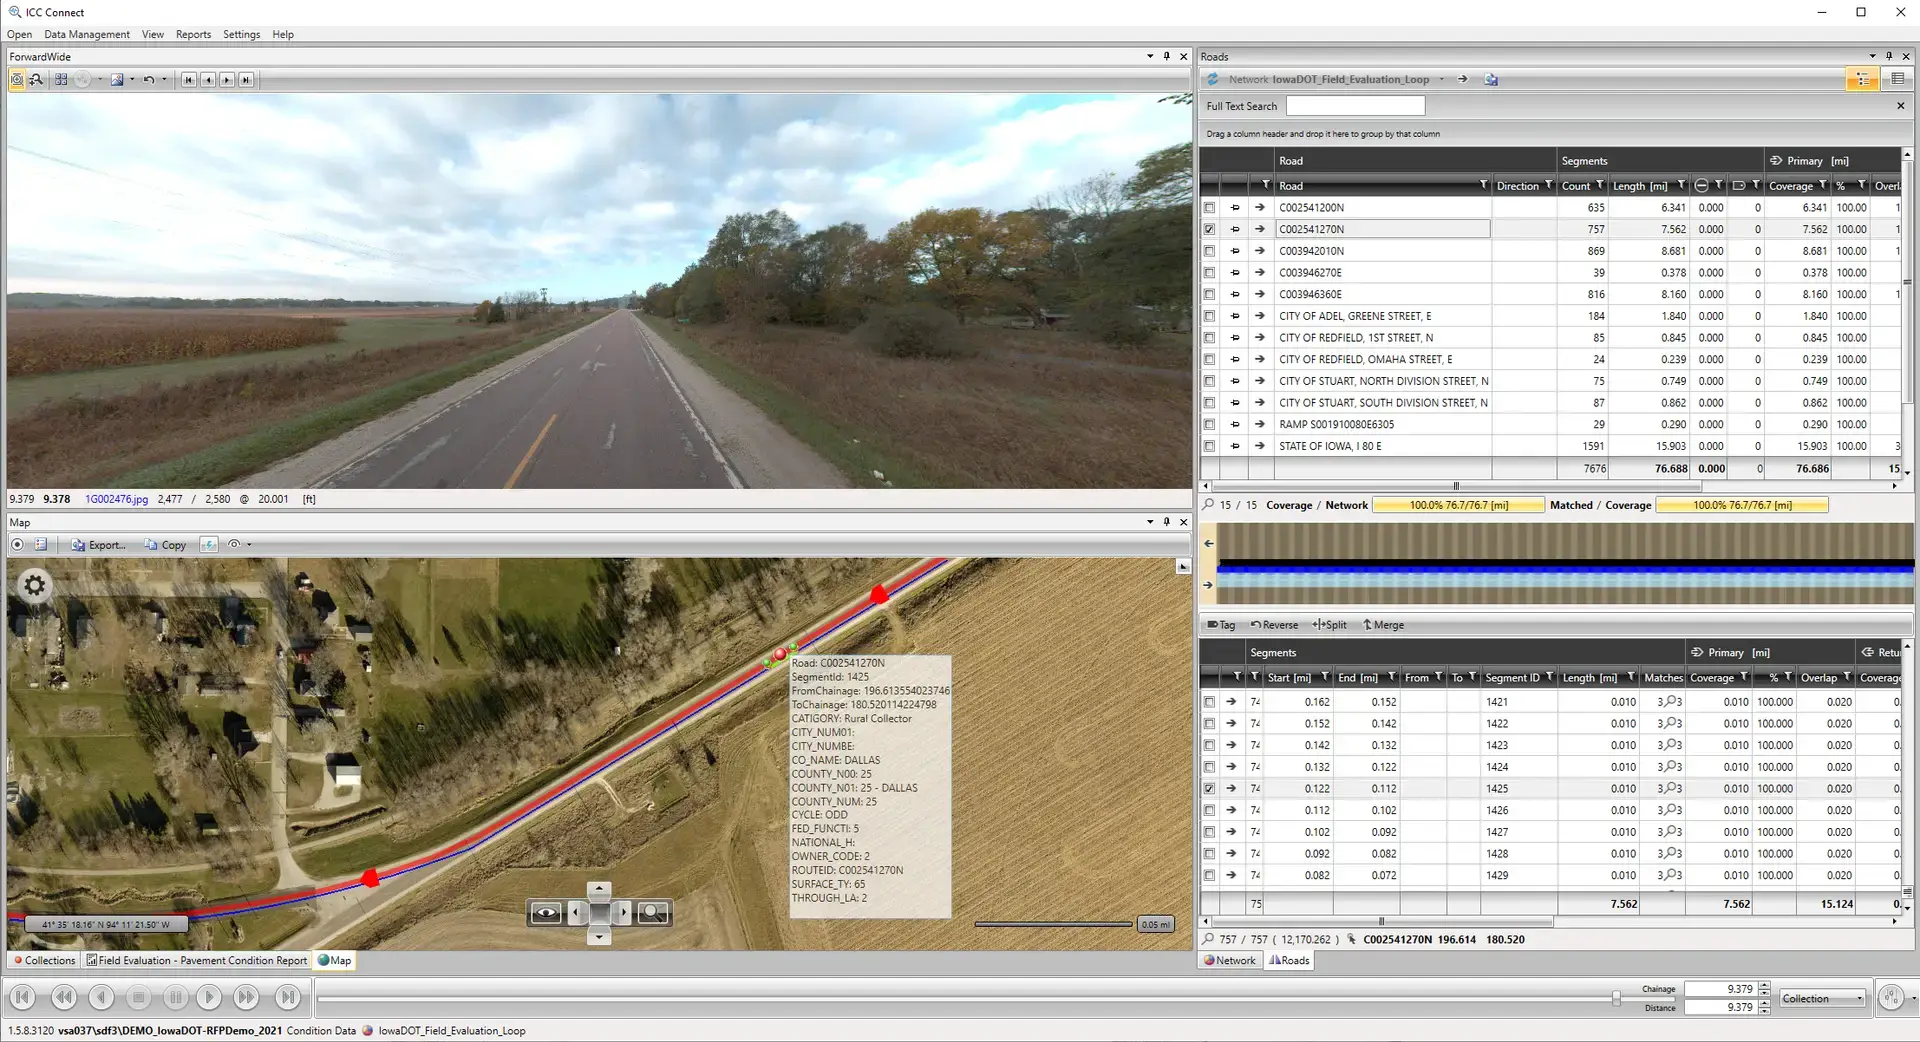
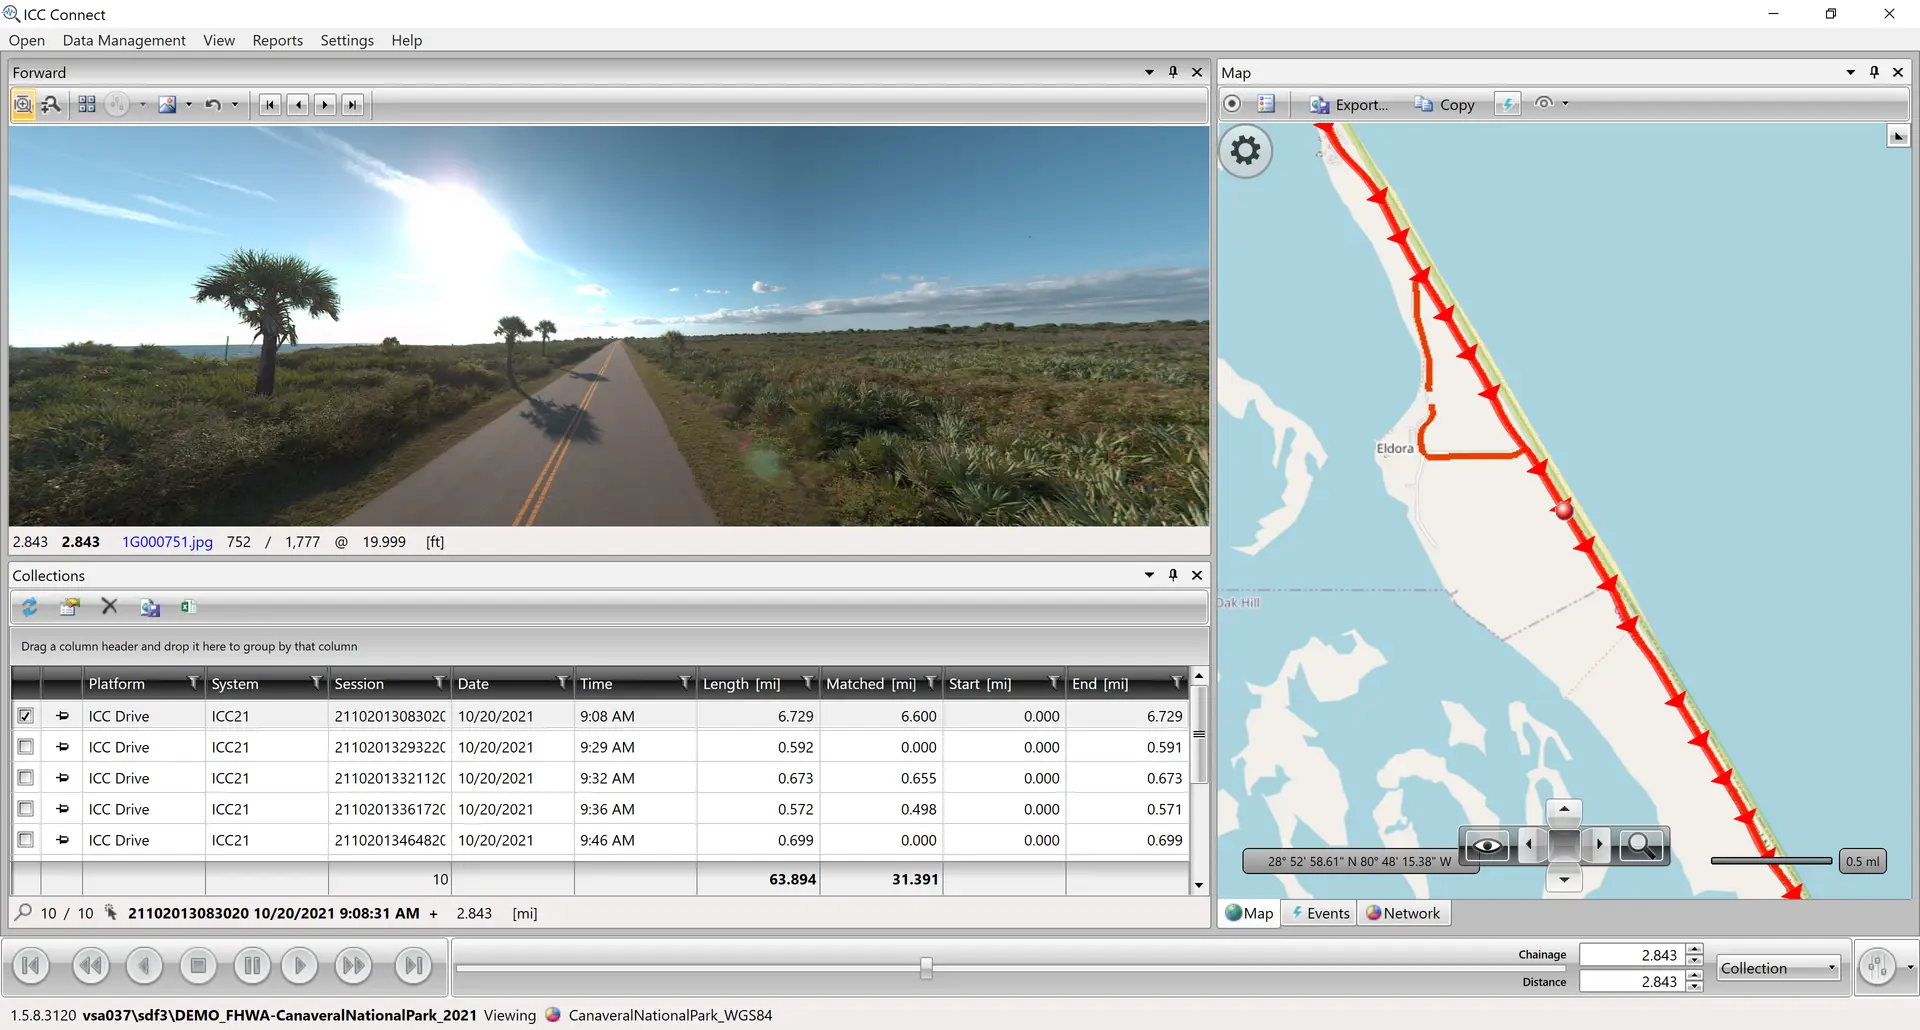
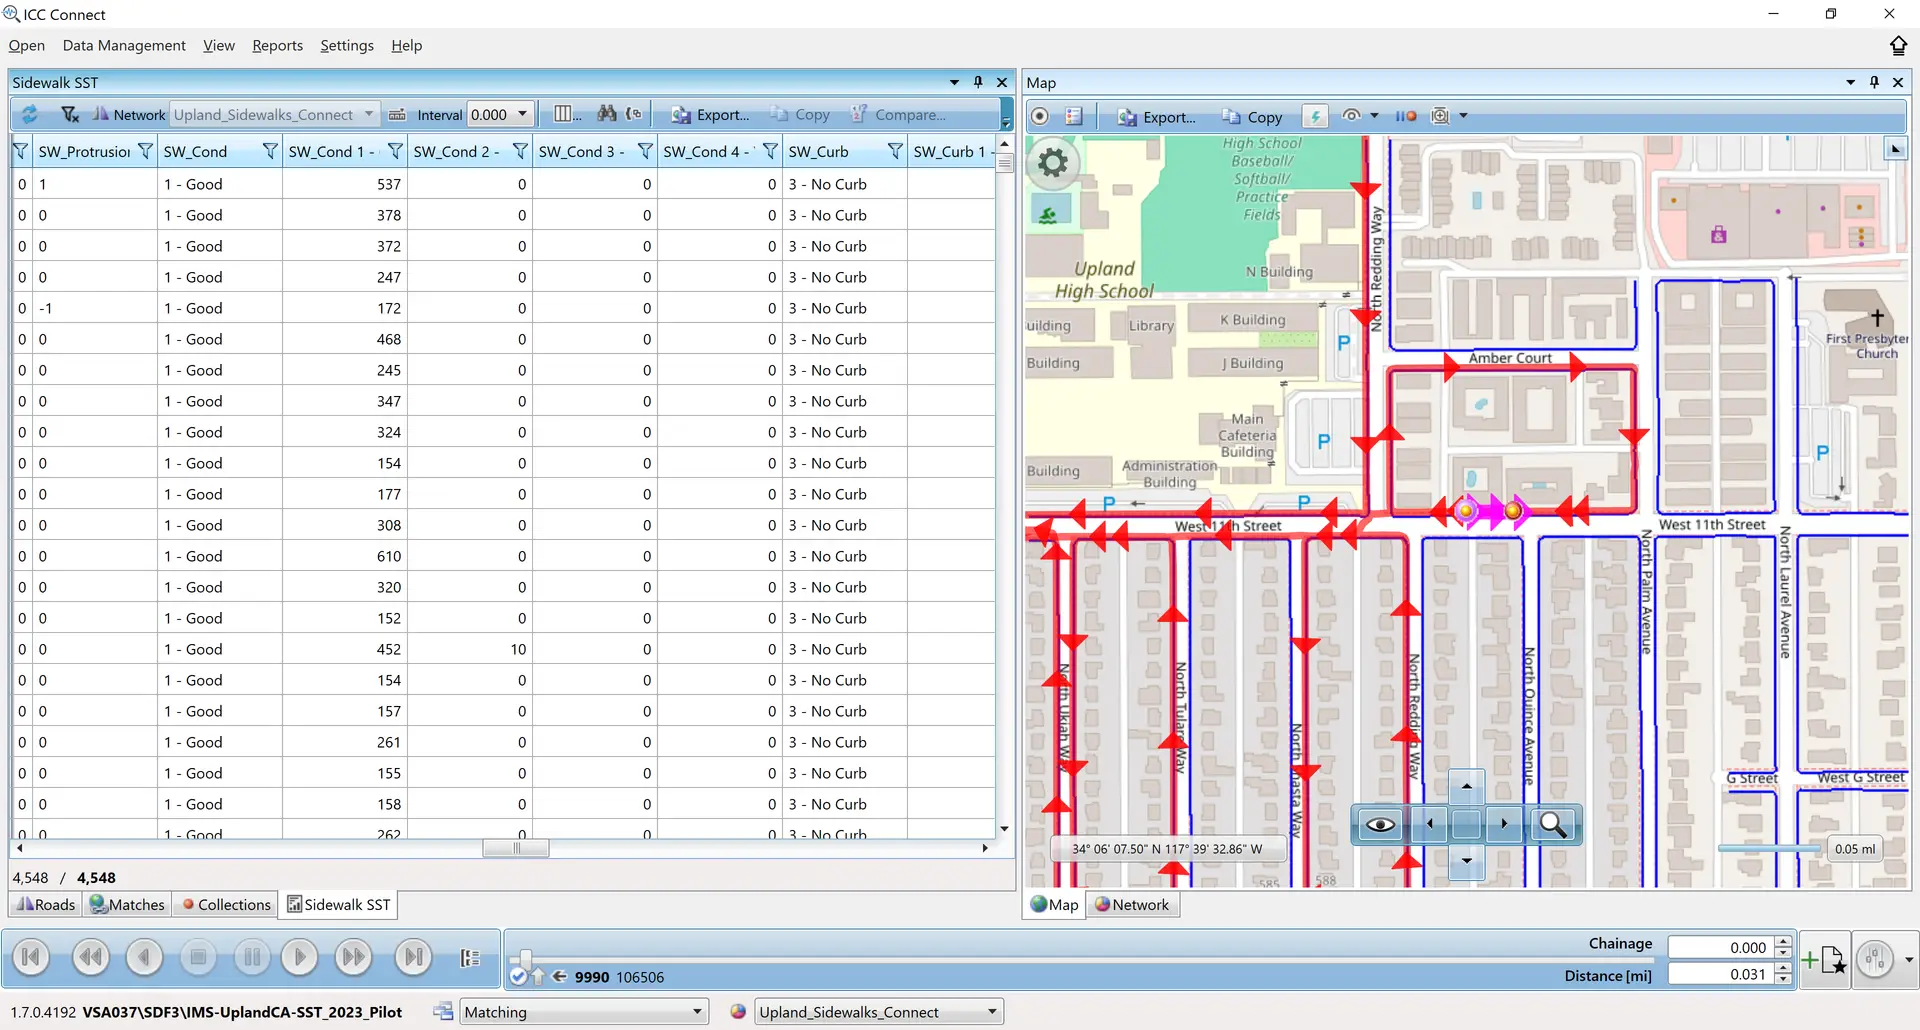
Automated network matching
Matching the collected data reliably to road network sections has been a challenge for many agencies and civil engineering firms. The advanced spatial network matching in Connect™ will save time and improve accuracy by joining your collected data to the road network defined in a GIS automatically.
Detect all deviations between the driven path and the road network centerline that exceed a user-specified tolerance. Match collected data to multiple road networks without creating separate databases (e.g. report the same collected data against construction sections, HPMS sections, and PMS sections).
In cases where the GIS network is outdated, you can optionally export the collected vehicle paths to geospatial formats so your GIS team can update their linework.
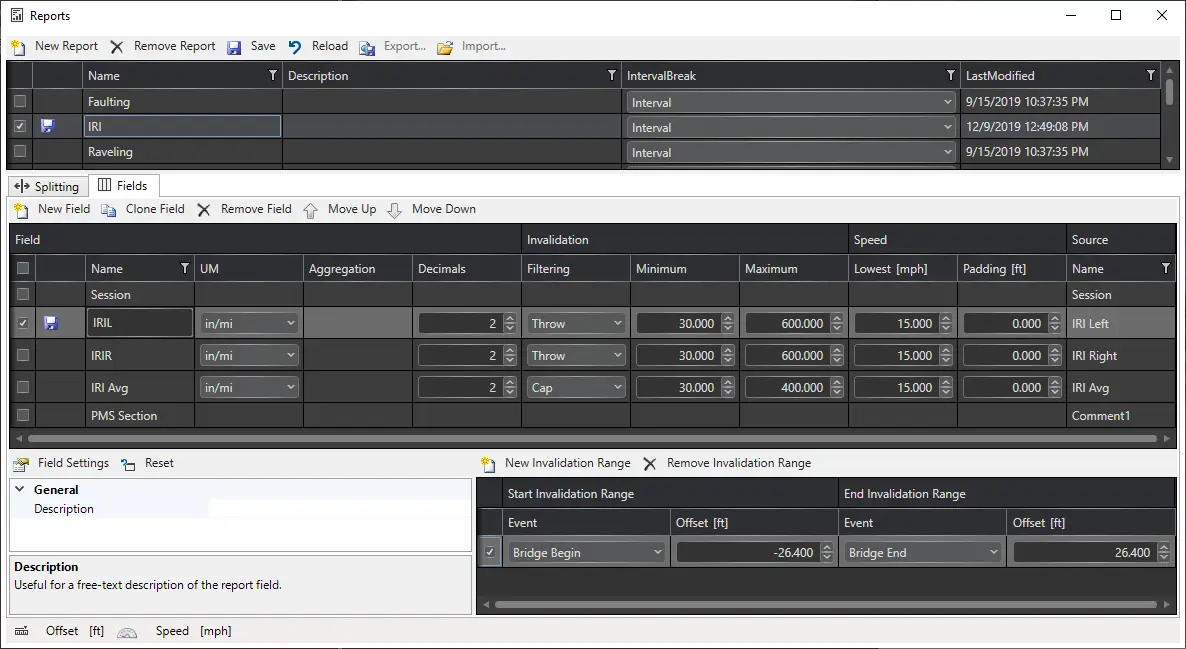
Report Builder
Connect™ has a fast, automated workflow to produce construction QC reports, HPMS reports, and road condition/PMS reports. The built-in, powerful report builder has the settings and options to meet all industry needs.
Produce 0.1-mile intervals and section summaries that match your GIS network lengths exactly, every time. Slab-based reports count how many slabs are affected by distresses and more, meeting HPMS reporting needs. Apply all your invalidation rules automatically (e.g. ignoring low speed IRI, excluding data near RRXs, ignoring bridge data in section totals/averages, applying different rules on different pavement types, etc). Recalculate reports based on edited event locations (e.g. section starts/ends, bridge locations, railroad crossings, lane deviations, etc).
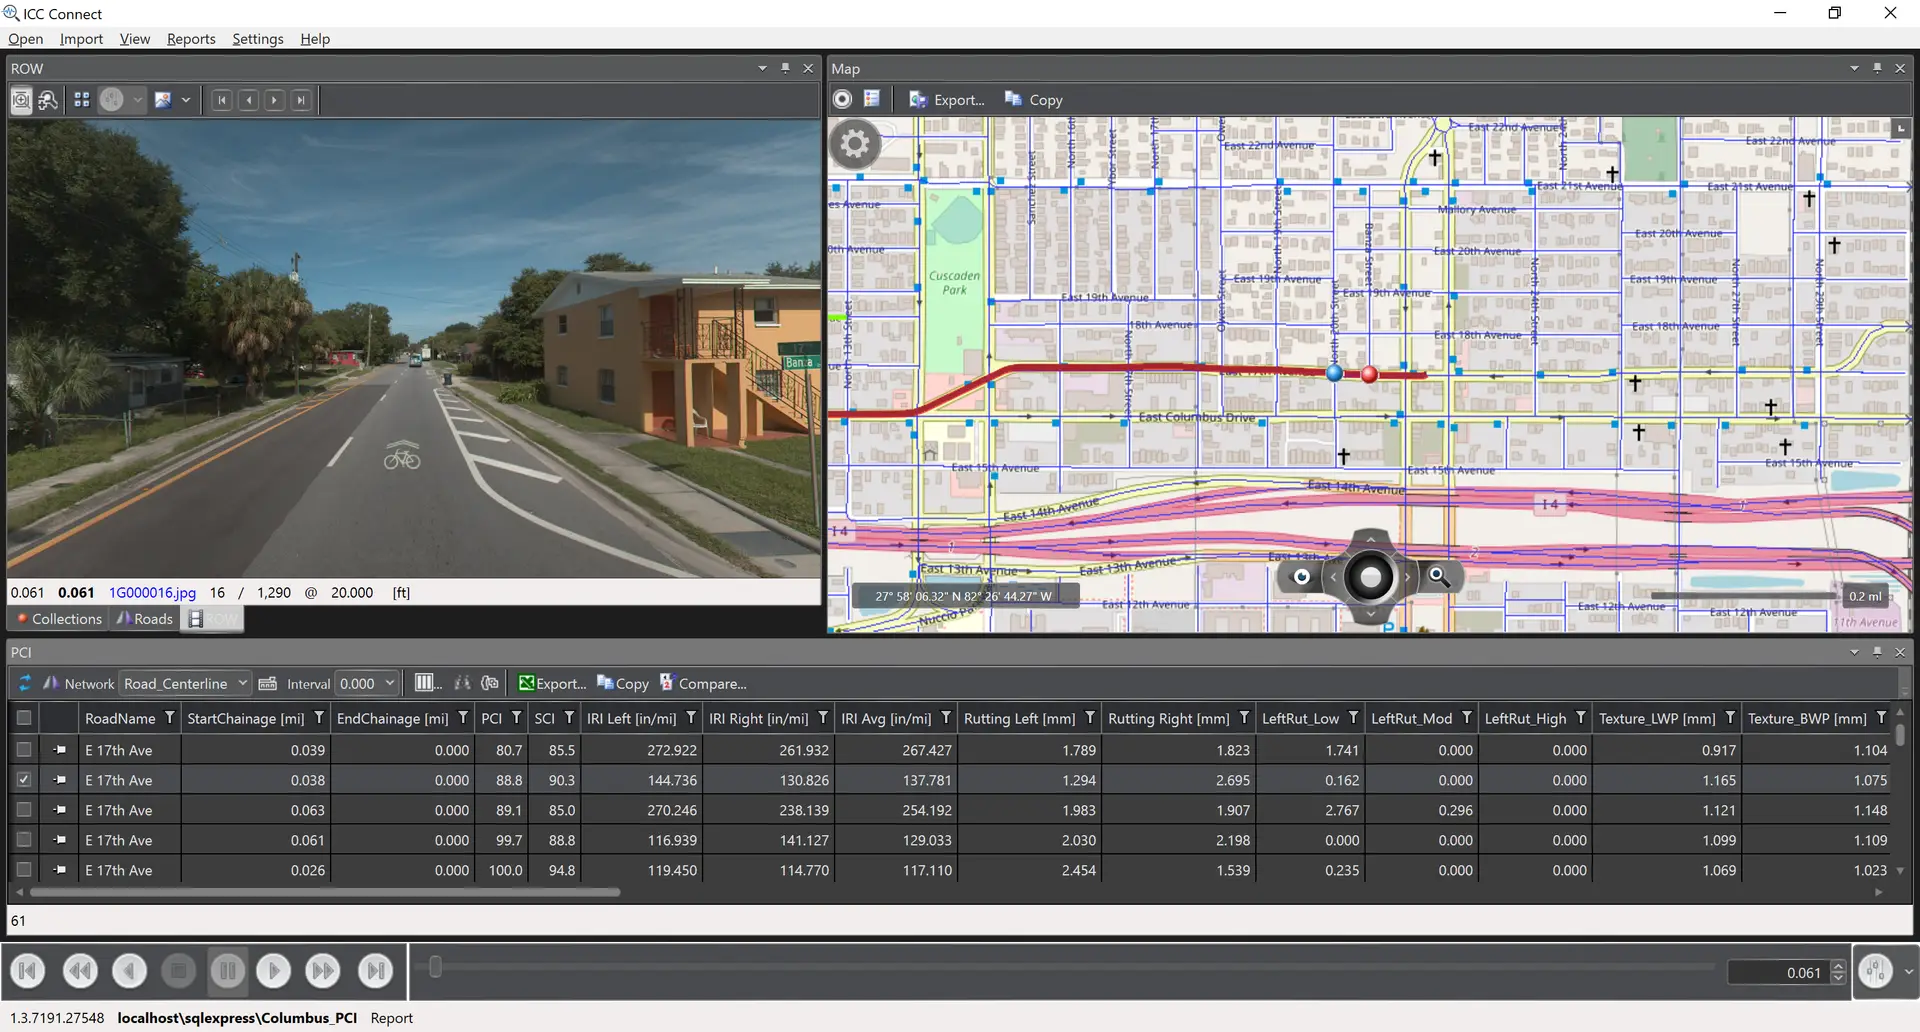
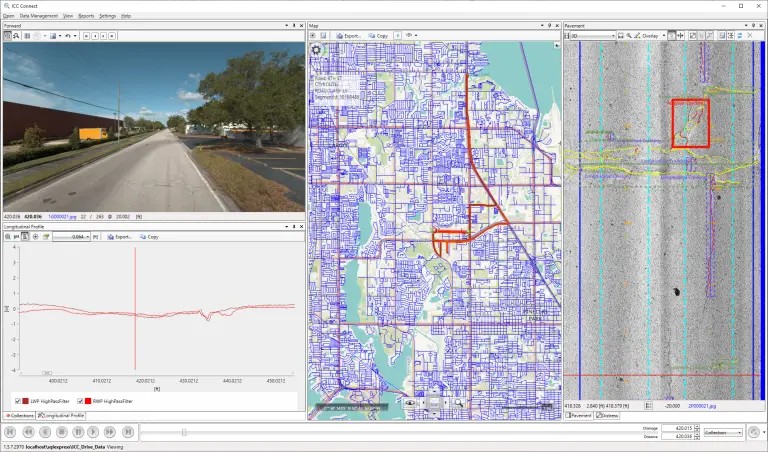
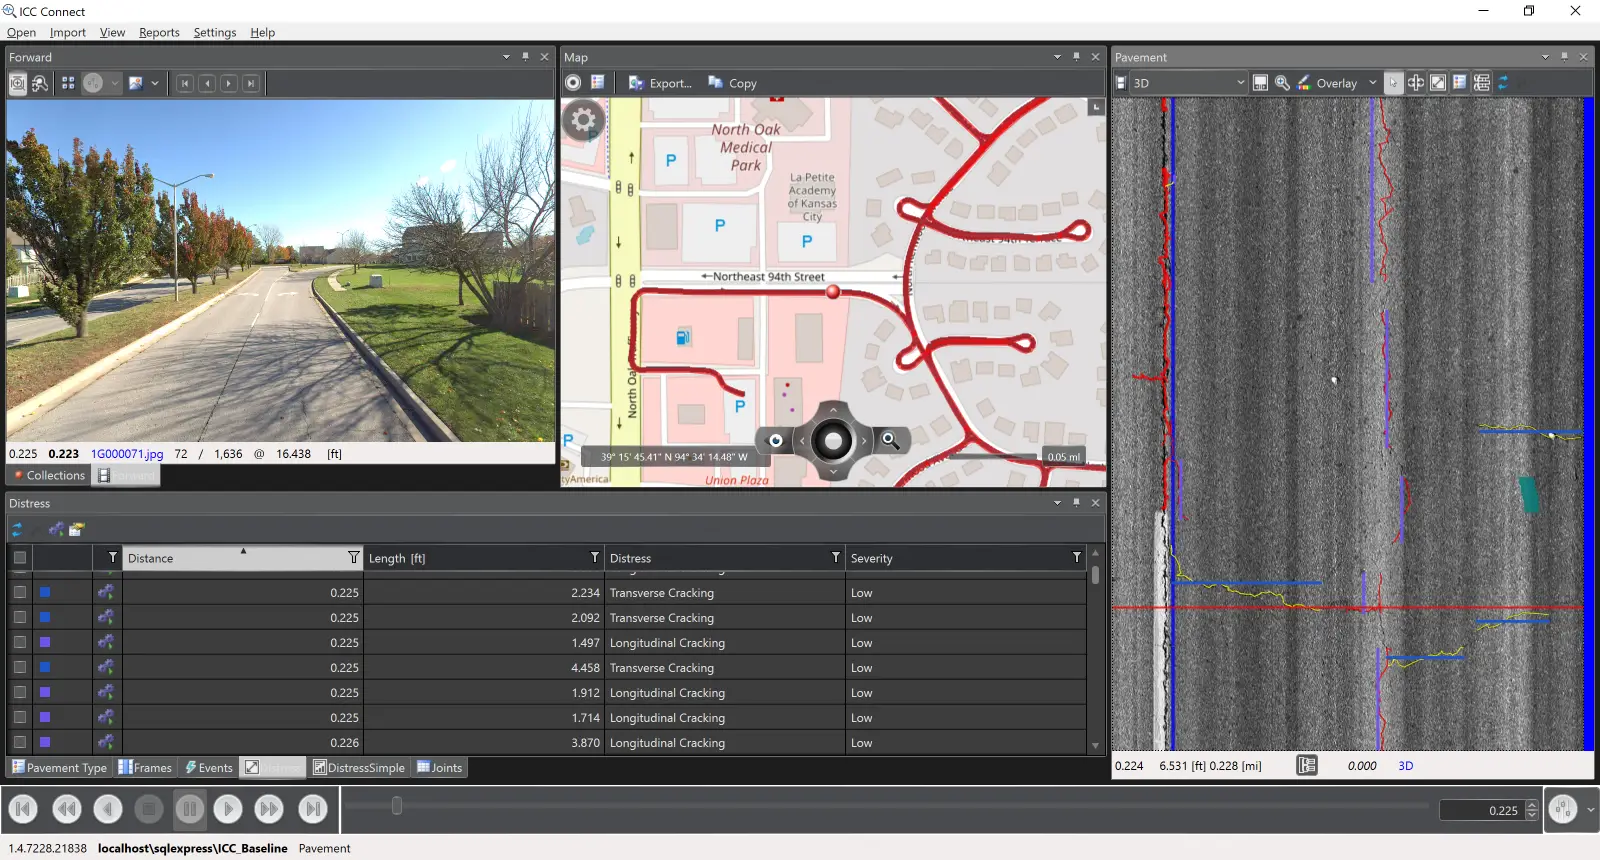
Would you like Details with that Summary?
Don’t settle for summary data only (e.g. 0.1-mile or 0.1-km interval). Synchronized viewing of all processed and raw data streams allows you to understand the condition of your road network at a glance, but also to drill-down into the details.
We call it “miles to inches.” Some of our friends call it “kilometers to millimeters.” Either way, all the data you need to analyze your pavements is readily accessible.
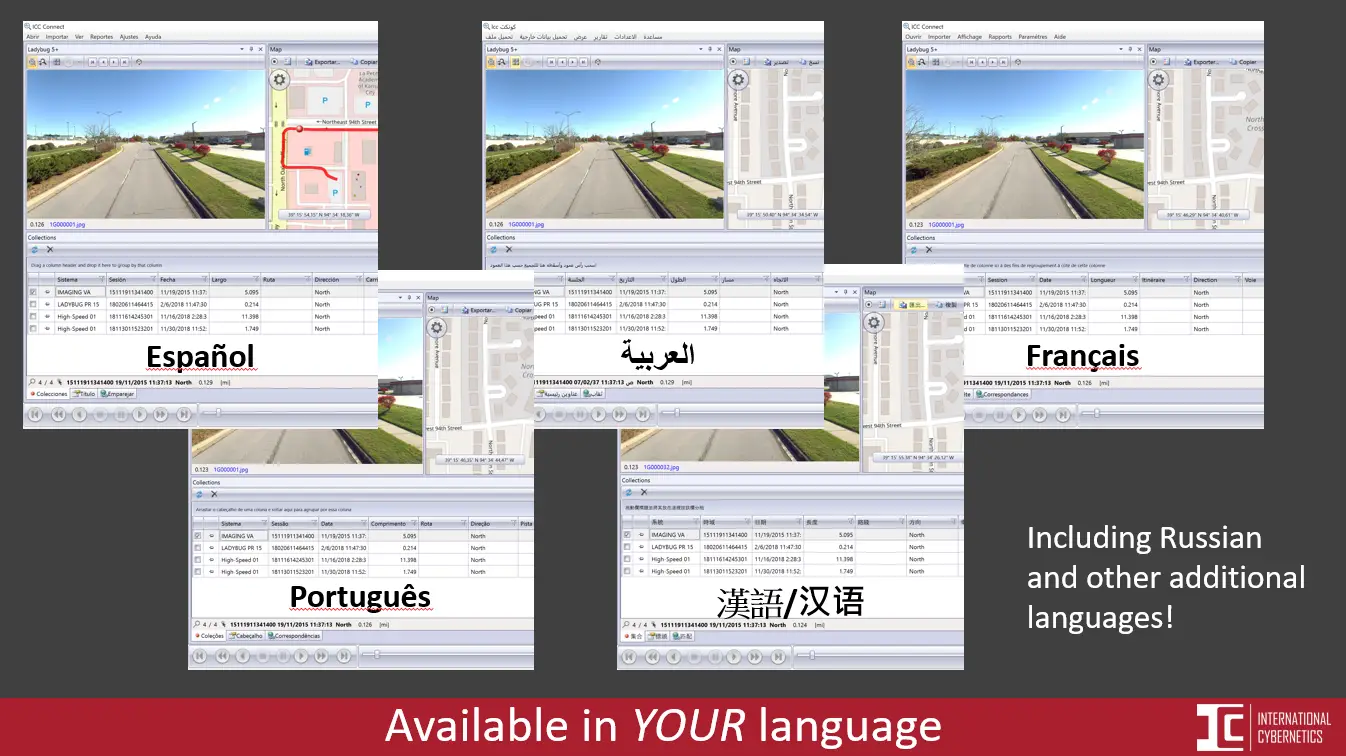
Available in your Language
Connect™ is currently available in 8 languages and we are adding support for more.
Built-in Quality Control
Identify out-of-range data values at both unit- and aggregation-levels, and select from multiple processing options such as cap or throw. Keep your entire processing and reporting workflow in one application to avoid human error often introduced with sequential, step-by-step processes.
Stay Up-to-Date
Connect™ is self-updating, so all of your users will always have the latest version of the software. Say goodbye to downtime, update scripts, and IT personnel involvement when new versions become available. Note: Auto-updates can optionally be timed to meet your organization’s update policy.
More Features
One-Step Import
Integrated Distress Rating
Reporting Options
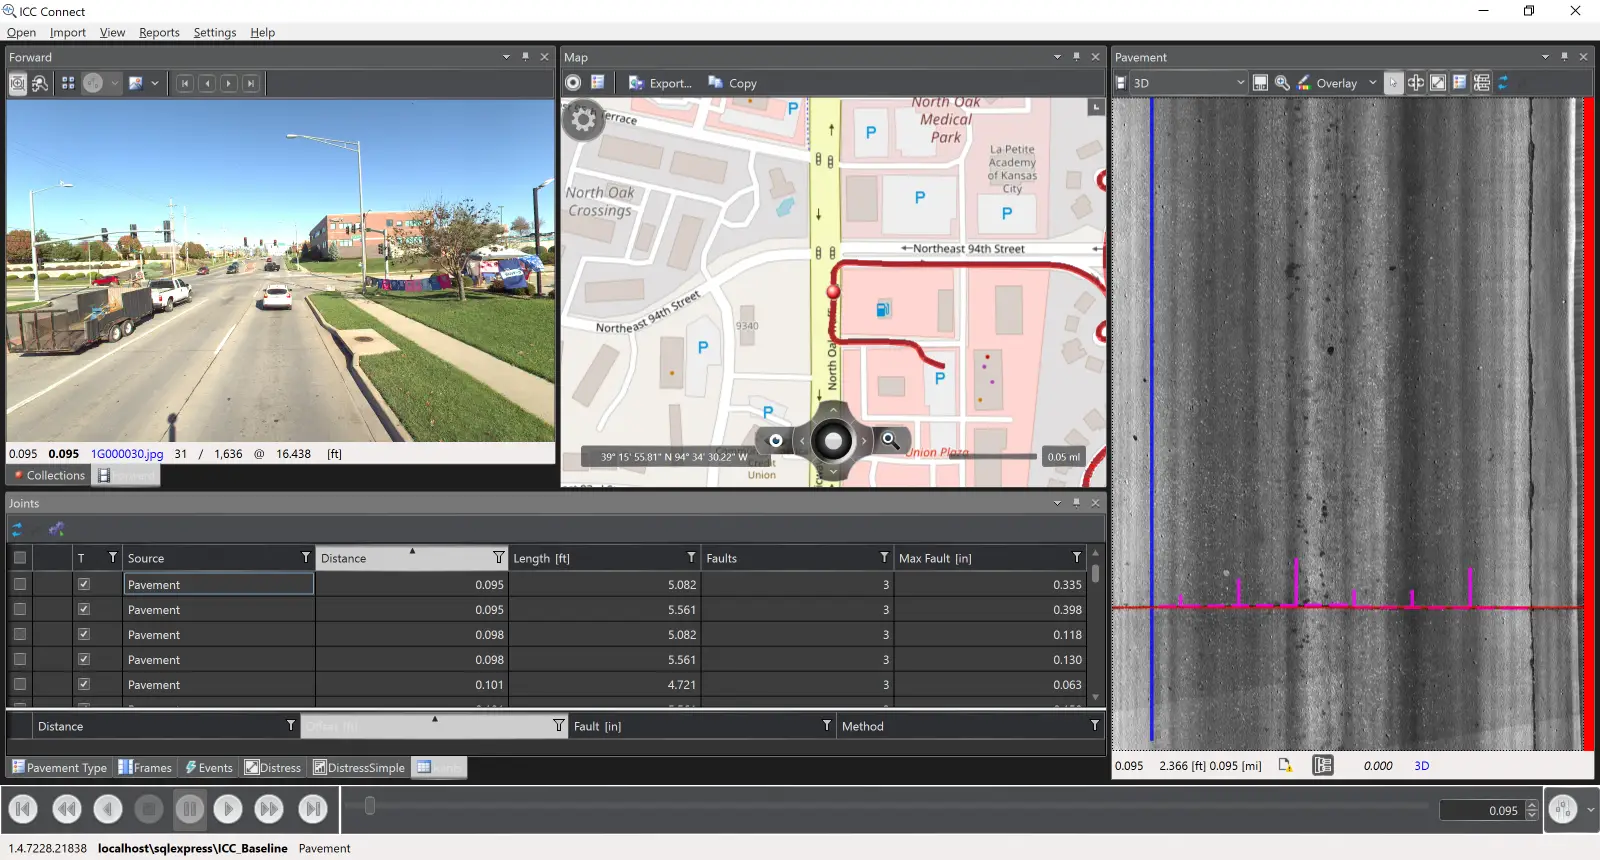
Joints and Faulting